Calculating financial ratios by itself does not necessarily create a lot of insight, with the true value-accretive steps being the interpretation of said data-points. I covered the definition and interpretation of financial ratios in depth in my book, however I noticed that readers often find it challenging to extract the correct figures from actual financial statement. This is no surprise since no financial statement looks quite like the other and often varying terms are used for one and the same accounting item. This is why this “how to calculate series” focuses squarely on the “calculation” part of the problem, using real financial statements and is mainly aimed at beginners and intermediate readers.
Calculating financial stability ratios
- Equity ratio
- Gearing
- Dynamic gearing
- Cash burn rate
Case study: Union Pacific
We will use the 2019 financial statement of Union Pacific, one of North America’s largest railroads, to show how to calculate the aforementioned financial stability ratios. Here is what the balance sheet looked like for fiscal year 2019:

The equity ratio is calculated by dividing total common shareholders’ equity of 18,128m USD by the balance sheet total of 61,673m USD, equating to 29.4 %. (In case there is any non-controlling interest included in the shareholders’ equity, this should be exluded when calculating the equity ratio since this part does not belong to the holders of the common stock).
The gearing is calculated by dividing the net financial debt by total shareholders’ equity. Net financial debt is the sum of Union Pacific’s financial debt less its cash and cash equivalents. The latter amount to 831m USD, where the financial debt equals 1,257m USD (“debt due within one year”) plus 23,943m USD (“debt due after one year”). In total this equates to net debt of 24,369m USD. Divided by total common shareholders’ equity of 18,128m USD gives a gearing of 134.4 %.
Equity ratio and gearing both yield static numbers. Dynamic gearing states the number of years necessary to delever the business completely on a cash basis by dividing the net financial debt by the annual free cashflow. We already obtained the net financial debt of 24,369m USD above. Free cashflow is calculating by simply subtracting net capex (in this case 3,453m USD – 74m USD = 3,379m USD) from the operating cashflows of 8,609m USD, yielding a free cashflow figure of 5,230m USD. Based on these numbers we can calculate the dynamic gearing or the time it would take to delever the business in full at 4.6 years (24,369m USD / 5,230m USD).

Case study : Nikola
There are different definitions for the cash burn rate, but the most common looks at the relationship between (negative) free cashflow and total shareholders equity. Another feasible calculation would be to look at (negative) free cashflow as a percentage of cash equivalents. Going with the former definition we need to obtain total shareholders equity as well as free cashflow for Nikola. Shareholders’ equity before non-controlling interest amounts to 881.5m USD as per 30 June 2020:

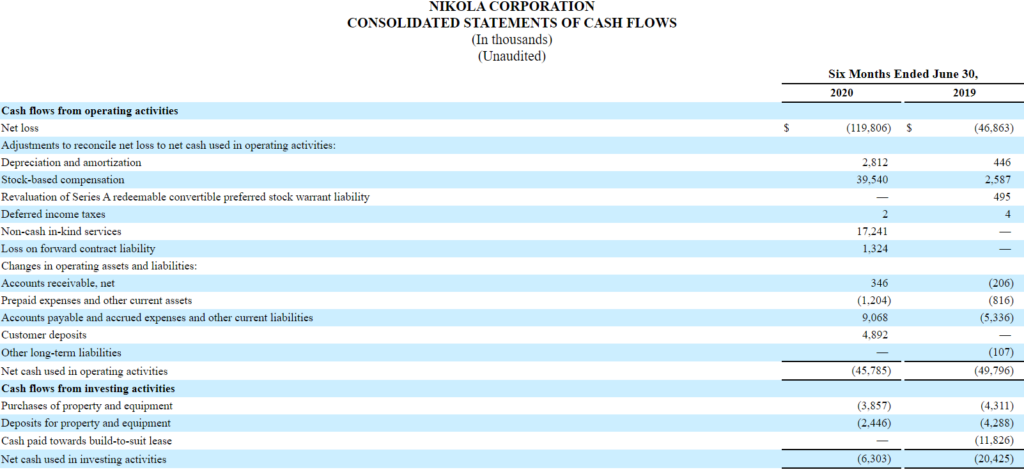
For the half-year 2020, the company shows operating cashflows of -45.7m USD as well as CAPEX of -3.8m and -2.4m USD, giving a free cash(out)flow of -51.9m USD.

This free cash(out)flow figure has of course to be annualized in order to calculate the cash burn rate with: 881.5m USD / -103.8m USD = -8.5 years. This means that if the free cashflow remains steady around -103.8m USD, the company would burn through its shareholders’ equity base with eight to nine years.