Calculating financial ratios by itself does not necessarily create a lot of insight, with the true value-accretive steps being the interpretation of said data-points. I covered the definition and interpretation of financial ratios in depth in my book, however I noticed that readers often find it challenging to extract the correct figures from actual financial statement. This is no surprise since no financial statement looks quite like the other and often varying terms are used for one and the same accounting item. In my book I tried to solve this issue by presenting the raw financial statement data as true-to-reality as possible, but I feel that a blog – with the ability to display the actual financial statement excerpts – might be a real value add. This is why this “how to calculate series” focuses squarely on the “calculation” part of the problem, using real financial statements and is mainly aimed at beginners and intermediate readers.
Calculating profit margins
- Gross profit margin
- EBITDA margin
- EBIT margin
- Net profit margin
We will use two real-life examples below to calculate the different profit margins listed above.
Case study: Alphabet
Google’s holding company Alphabet shows the following profit & loss statement for fiscal year 2019:
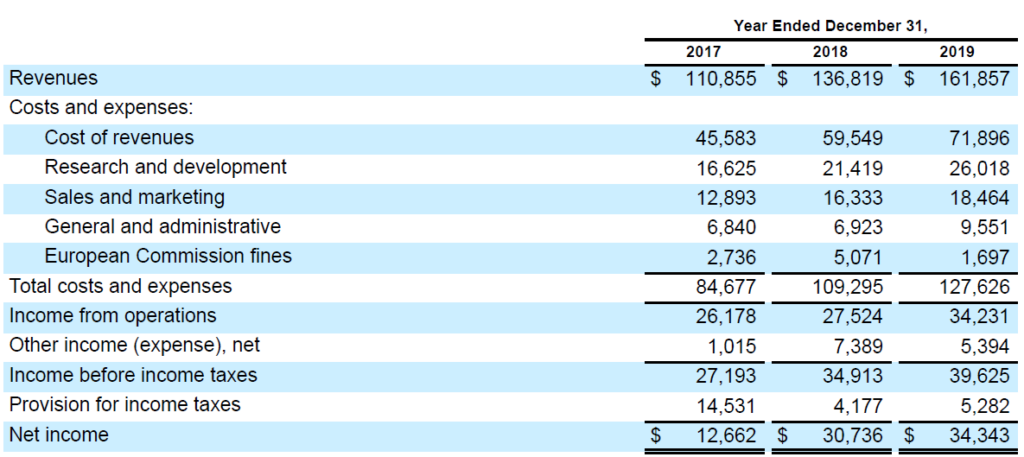
The gross profit margin is defined as gross profit divided by revenues. In this case the gross profit is not shown directly in the profit and loss statement, but can be derived easily by subtracting the cost of revenues from the revenue line. This yields a gross profit of 161,857m USD – 71,896m USD = 89,961m USD. Dividing this figure by the stated revenues yields a gross profit margin of 89,961m USD / 161,857m USD = 55.6 %.
The EBITDA margin is defined as EBITDA divided by revenues. In order to calculate the EBITDA margin we first have to calculate the EBITDA figure. Our starting point is the reported EBIT, which in this case is reported as “income from operations” of 34,231m USD. To this we need to add the depreciation and amortization expense (the “DA” part of EBITDA) which in the case of Alphabet has been allocated towards the different expense categories and hence cannot be found directly in the profit and loss statement. However, being a non-cash expense, the depreciation and amortization number can be easily found in the cash flow statement, in this case 10,856m USD and 925m USD respectively:
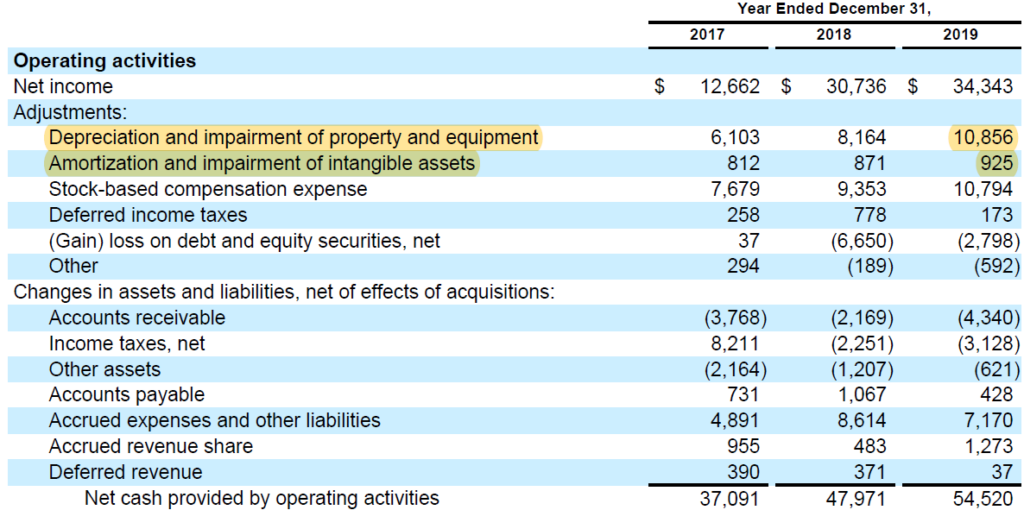
Adding EBIT to depreciation and amortization yields an EBITDA of 46,012m USD, which results in an EBITDA margin of 28.4 %.
Given the EBITDA margin derivation makes calculating the EBIT margin straight forward: simply divide the stated EBIT (“Income from operations”) by the revenues, et volia: 34,231m USD / 161,857m USD = 21.1 %.
Finally, the net profit margin is defined as net profit dividend by revenues, which in this case means dividing the net profit of 34,343m USD by total revenues of 161,857m USD, giving a net profit margins of 21.2 %. Note that in this unusual case the net profit margin exceeds the EBIT margin because of the significant “other income” line below EBIT.
Case study: Heineken
Heineken, the world’s second largest brewer, reports the following profit and loss statement for fiscal year 2019:
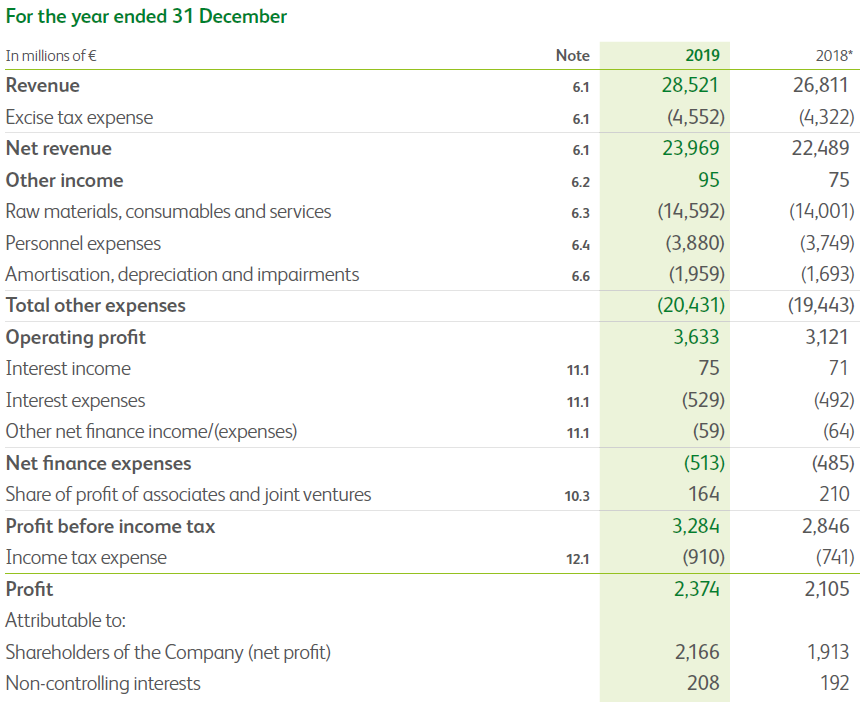
Heineken is an interesting case study to see how calculating profit margins can be straight forward and yet still might need some explaining. In this case one might wonder whether to use the “revenue” or the “net revenue” line as the denominator. Most beverage companies report their revenue including and excluding excise tax, in order to get consistent results it is usually advisable to use the net revenue as the denominator, since only these revenues are truly available to the company in order to pay its various expenses.
Since the gross profit is not stated directly in this profit and loss statement, it has to be derived by subtracting the cost of goods sold (in this case “raw materials, consumables and services”) from net revenues, i.e. 23,969m EUR – 14,592m EUR = 9,377m EUR. Dividing this numbers by the net revenues yields a gross profit margin of 39.1 %.
The EBITDA margin is easy to calculate since the EBIT (“operating profit”) as well as the depreciation and amortization expenses are given directly in the profit and loss statement. Adding back the 1,959m EUR to the EBIT of 3,633m EUR yields an EBITDA of 5,592m EUR, divided by the net revenues yields an EBITDA margin of 23.3 %.
Accordingly, the EBIT margin can be obtained by dividing the operating profit of 3,633m EUR by net revenues of 23,969m EUR = 15.2 %.
The net profit margin could cause some questions in this case, since 208m EUR of the stated net profit of 2,374m EUR is attributable to non-controlling interest. If we were to calcuate the earnings per share attributable to shareholders of Heineken, 2,166m EUR would be the correct number, since only this profit is available to the holders of the company’s common stock. However when calculating the profit margins, the stated net profit of 2,374m EUR has to be sued. Why? Since the non-controlling interests are not just included in the net profit, but also in the net revenue line. Hence in order to get a like-for-like comparison, the full net profit has to be compared to the net revenues. This yields a net profit margin of 2,374m EUR / 23,969m EUR = 9.9 %.